Friday, June 4th, 2010
10

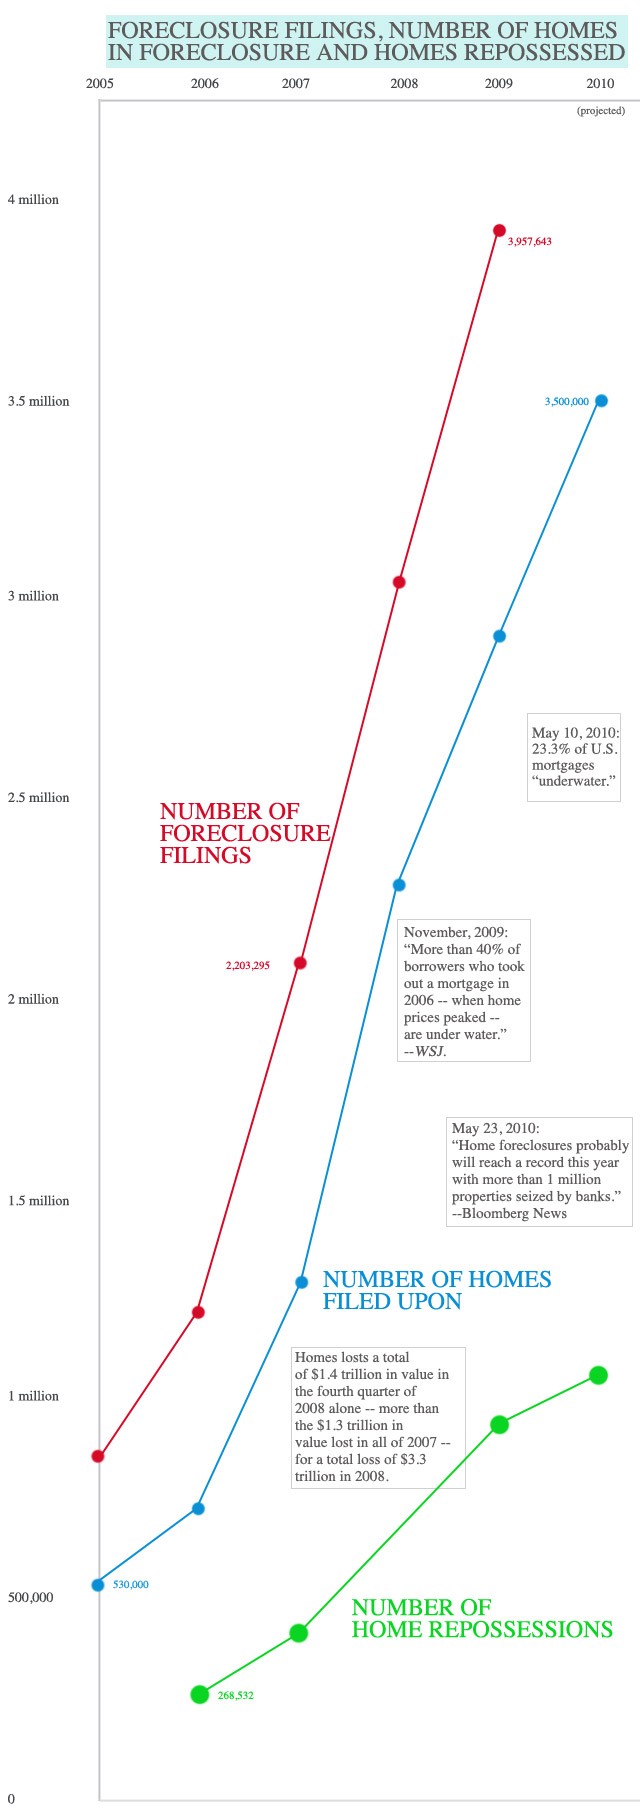
Graphed: U.S. Foreclosures and Home Repossessions, 2005 to 2010

It's hard to get a sense of what's going on in America with foreclosure filings, the number of homes being foreclosed on and the actual number of houses being taken back by banks. The newspapers are confusing! Are they "down"? Are they "up"? So we dug up the actual numbers for each year since 2005, up to the projected numbers for 2010. A "foreclosure filing" can be a number of things, including notice of default, auction or seizure-which is why the actual number of houses receiving these notices is a useful number to know.

Foreclosures

10 Comments / Post A Comment

I'd like to see this go back to pre-housing bubble, since if one was in financial trouble during the bubble, one could just borrow more money from your house to pay the mortgage on that house.

Matt (#26)

Why can't the people just move into the bubbles is the thing that I have always wondered. Problem solved!

saythatscool (#101)

That joke killed John Travolta.

Art Yucko (#1,321)

Turning your attic into an ATM Cash Dispensary is great, until your realize that the Squirrels are running the bank. Oh, they've been charging you fees. CEO Raccoon knows how to live large, at your expense.

dado (#102)

You can prove anything you like with statistics. 4 out of every 5 people know this.

gregorg (#30)

See, I think this is misleading because the numbers are so big.

hockeymom (#143)

This graph looks much better if you turn your computer screen upside down.

cherrispryte (#444)

Um in unrelated news, you made a Dr. Who reference in your newsletter. This made my Friday.

Art Yucko (#1,321)

the lactic acid in this vessel has undergone molecular separation. exterminate.

Pandemic Endemic (#3,825)

The red line is the daddy, the blue line is the mommy and the green line is the baby.

Post a Comment