Goldman Sachs Overcorrects A Decade of Employee Compensation Trending
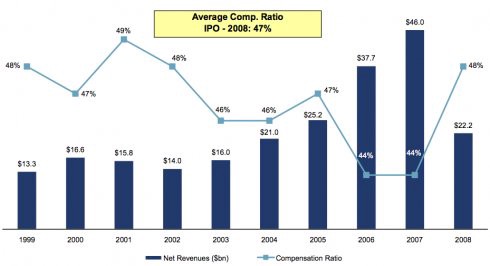
For the first time since no one is sure when, Goldman Sachs has altered its general formula of close to a 50/25/25 annual net revenue allocation (in which, give or take, 50% goes to the employees, 25% is (sort of) set aside for taxes and 25% is retained for the company). This year? In what is being described as a PR move, just a bit over 35% is going to bonuses. (2009’s net revenue comes to $45.2 billion, so $16.2 billion is set aside for employees.) In the last ten years, the compensation rate has never dipped below 44% of net revenues.
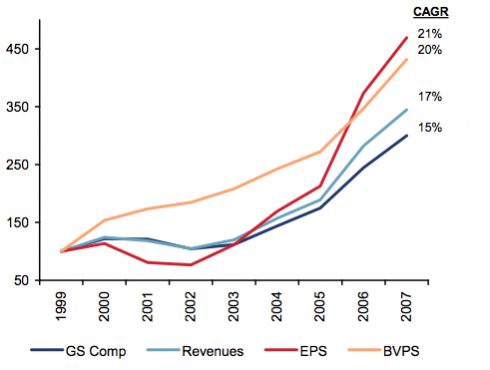
Ignoring the “Book Value Of Equity Per Share” and the “Earnings Per Share” in the graph above, because we are not bankers, this graph shows employee compensation outpacing, over time, the company’s annual net revenues from 1999 to 2007.
So this year’s downturn in employee revenue percentage can also be seen as a (severe) correction to that trend (a trend that continued in 2008, thanks to extremely low revenues).
Now, as for the tax number, in relation to net revenue? This year, they’re back to a fairly-appropriate 32.5% tax rate.
Lest we forget? In 2008, with $2.3 billion in profit, and $22 billion in net revenue (about half of 2007’s net revenue), and while dispensing $10.9 billion in employee compensation, Goldman had planned to pay almost exactly 25% in taxes-but, thanks to their fourth quarter, in the end expected to “pay $14 million in taxes worldwide for 2008, compared with $6 billion in 2007.” That was a tax rate of 1%.